Four massive clusters from DES SV data
We went out to test DECam, and got galaxy clusters and filaments
For the first paper with data from the Dark Energy Survey, I led a large team of DES collaborators and used the Dark Energy Camera (DECam) on the CTIO 4-m telescope to study four massive galaxy clusters. The targeted clusters were well known— one of them is the famous Bullet Cluster, the poster child of merging clusters—so that the findings from DECam data could be cross-checked with existing results. If this could be done successfully, it would not only validate the instrument and the DES analysis pipelines, but utilizing the entire 3 square degree field of view would also allow an investigation of the large-scale environment from which these clusters accrete their material.
We chose a demanding technique, namely weak gravitational lensing, to infer integrated cluster masses and two-dimensional mass distributions. This presents a formidable challenge for instrument and pipelines because weak lensing has very stringent requirements on image quality as well as astrometric accuracy and photometric uniformity. Since weak lensing is encoded in imperceptibly small changes in galaxy sizes and ellipticities, the first test for any successful analysis is how well the telescope’s PSF can be modeled. While stellar ellipticities could be modeled accurately, getting the stellar sizes right proved to be a harder problem. The bulk of all stars appeared about 1 per cent smaller than the model that was build from them. The reason for this mismatch lies in the thick, fully depleted CCDs used in DECam, which have a mild flux-dependent registration of charges, the so-called “brighter-fatter” effect. The few very bright stars, which dominate the PSF model, create so many charges in the central pixels that newly incoming charges get slightly repelled by the charges already present, causing the star to appear broader than it would if it were fainter. To build precise PSF models the brightest stars (three magnitudes below saturation level) therefore had to be rejected. A pixel-level correction of the effect is currently in the works, so that DES will not have to resort to rejecting bright stars in forthcoming analyses.

Combining weak-lensing measurements with photometric redshifts (photo-z’s) for the background galaxies, one can infer the mass of the cluster that acts as lens. Fig. 1 shows the mean tangential ellipticity, the primary weak-lensing signal, as function of separation from the Brightest Cluster Galaxy (BCG) of the cluster RXC J2248.7-4431 (z = 0.348). Also shown are 100 MCMC samples of Navarro-Frenk- White (NFW) profile fits to the data, a standard choice to describe the radial profile of dark matter haloes. The parameters of this model are the mass M200c enclosed in a given aperture, here within a sphere that contains 200 times to critical density of the universe at the redshift of the cluster, and the concentration c200c that describes the slope of the profile within the same aperture. The resulting fits yielded a cluster mass that was in good agreement with previously published results. Moreover, we could show that the cluster mass estimates remained unchanged when the weak-lensing measurements were done in any of the riz filters, demonstrating that all relevant instrumental effects were accounted for.
Fig. 1 also demonstrates that the NFW profile is often not a good fit to individual clusters, whose mass distributions tend to deviate more or less prominently from any spherical model. Indeed, the contours in the left panel of Fig. 2 show the two-dimensional mass distribution as inferred from weak lensing (a so-called aperture-mass Map map in units of its dispersion) in an area of 30 × 30 arcmin, revealing a strongly elongated cluster. Also shown (as black dots) are red-sequence galaxies at the redshift of the cluster, identified by the redMaPPer code (Rykoff et al. 2014). Their redshift estimates from five-band grizY imaging of DES are found to exhibit a scatter of only 0.015, significantly more precise than the typical DES photo-z scatter of ~0.1. As another confirmation of a successful lensing analysis, the mass distribution of this cluster is tightly traced by its red-sequence galaxy distribution.

With the accuracy of the red-sequence redshifts, the DES data allowed to connect the central cluster region to its larger-scale environment, literally by following a string of galaxies. The right panel in Fig. 2 shows the same red-sequence galaxies as the central panel, in a narrow redshift slice, for an area of 90 × 90 arcmin. It became evident that this massive cluster is embedded in a filamentary structure that spans about 12 Mpc towards another, less massive cluster (red diamond). The Bullet Cluster, the other very massive and actively merging cluster in the sample, showed a similarly rich environment.
That filaments connect clusters, particularly the very massive ones, is not news: it had been predicted from simulations and observed spectroscopically. But being able to map out the cluster environment without spectroscopy bears truly exciting prospects for large-scale structure studies in the 5,000 square degrees of DES.
Extra figures
RXC J2248.7-4431

1E 0657-56 (aka Bullet cluster)

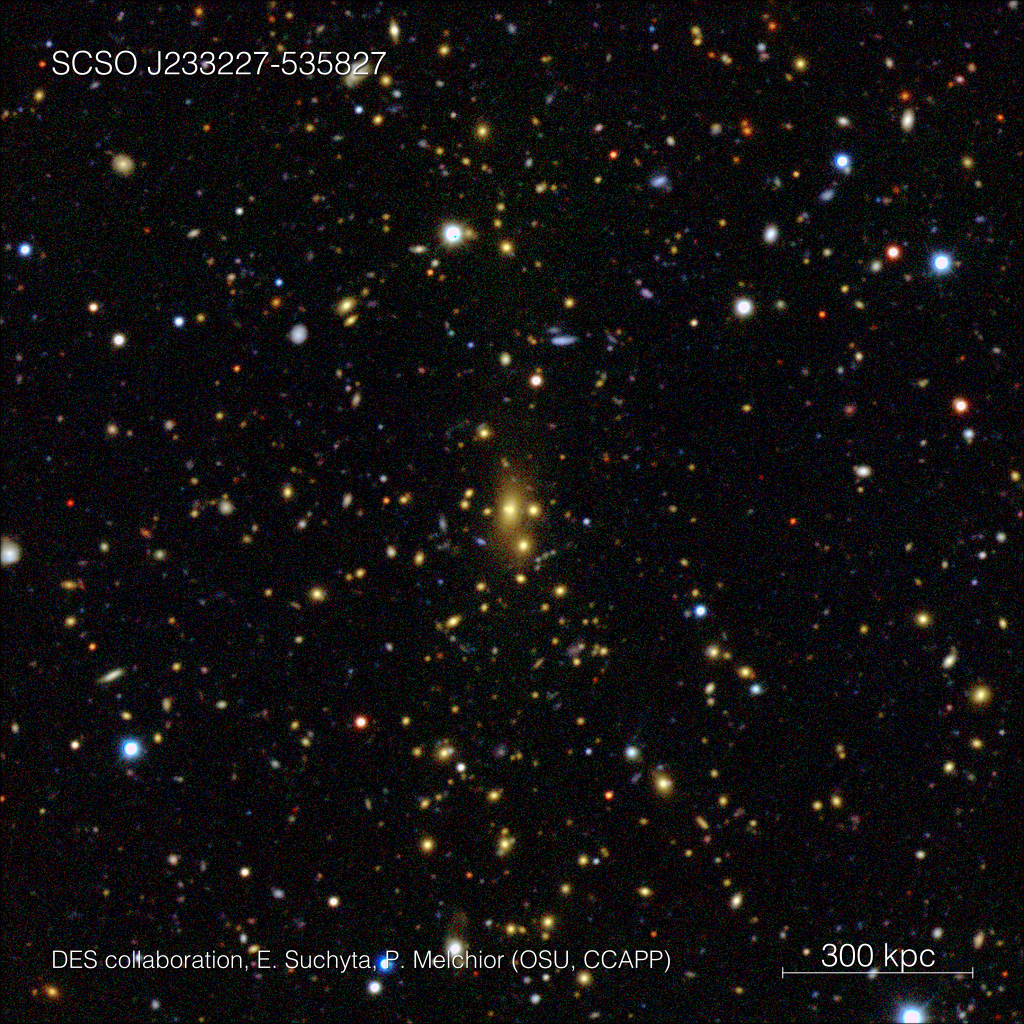
SCSO J233227-535827

Abell 3261
